Kenya Total Exports to USA
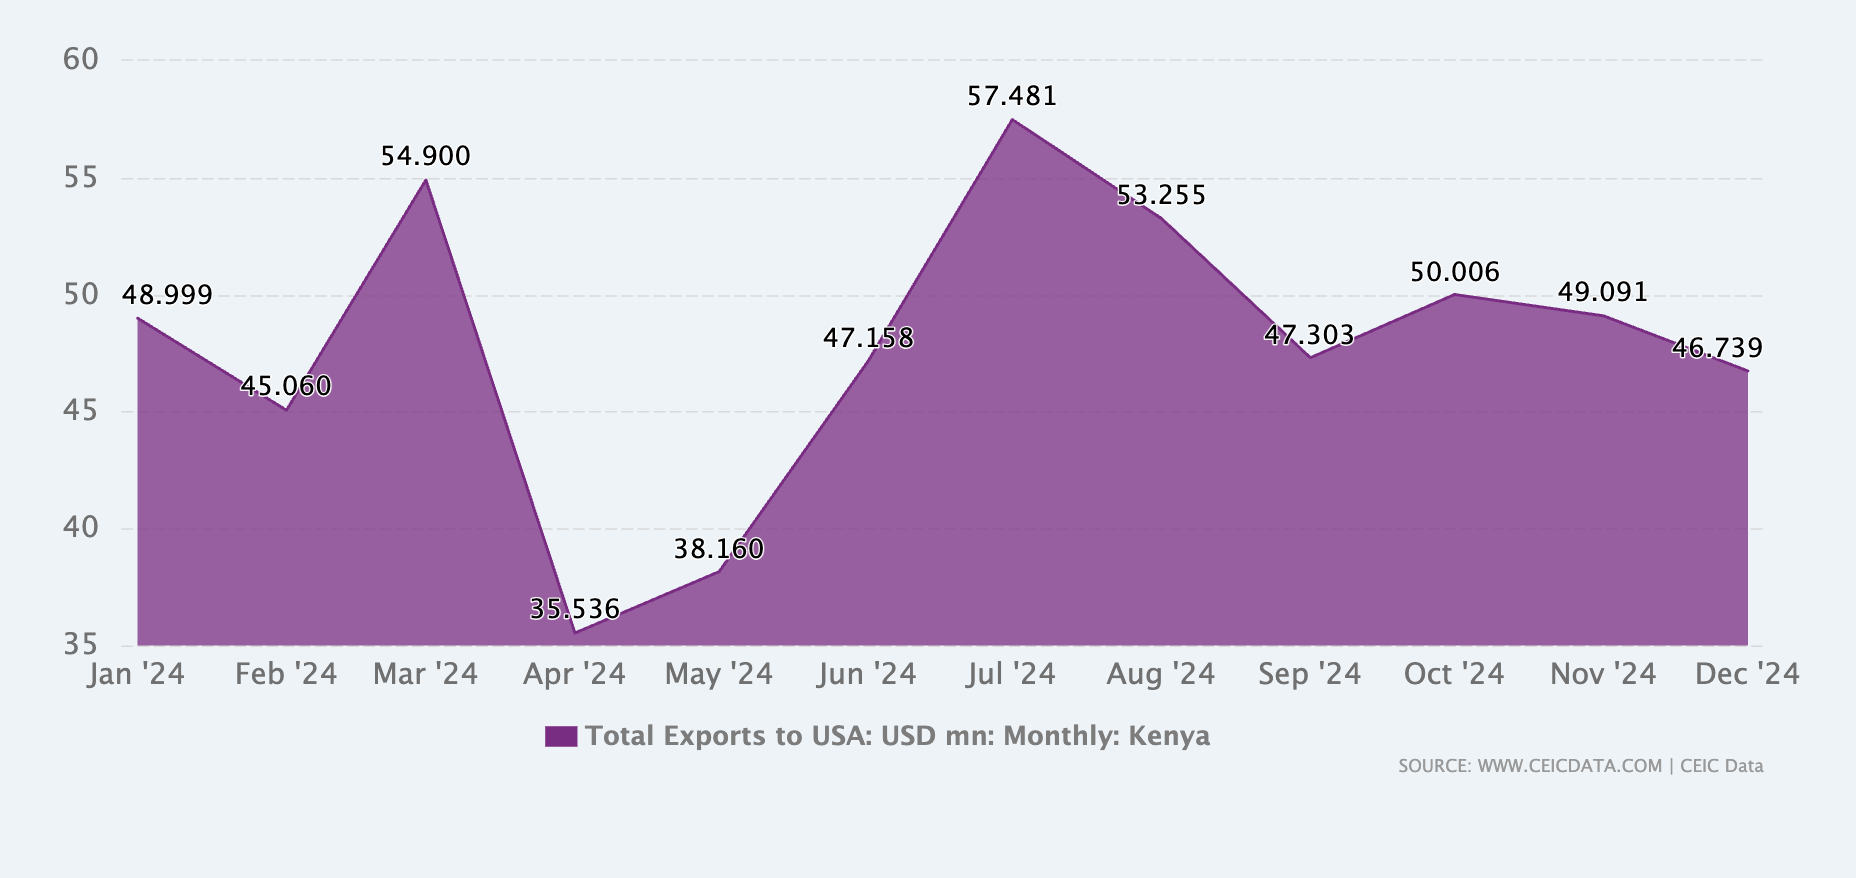
Key information about Kenya Total Exports to USAKenya Total Exports to USA recorded 46.739 USD mn in Dec 2024, compared with 49.091 USD mn in the previous Nov 2024Kenya Total Exports to USA data is updated monthly, available from Jan 1998 to Dec 2024, with an averaged value of 25.593 USD mnThe data reached an all-time high of 89.667 USD mn in Jun 2022 and a record low of 1.506 USD mn in Dec 2001CEIC converts monthly Total Exports to USA into USD. The Central Bank of Kenya provides Total Exports to USA, FOB, in local currency. The Central Bank of Kenya average market exchange rate is used for currency conversions.
| Month | Total Exports to USA (USD mn) |
| Jan-24 | 48.999 |
| Feb-24 | 45.060 |
| Mar-24 | 54.900 |
| Apr-24 | 35.536 |
| May-24 | 38.160 |
| Jun-24 | 47.158 |
| Jul-24 | 57.481 |
| Aug-24 | 53.255 |
| Sep-24 | 47.303 |
| Oct-24 | 50.006 |
| Nov-24 | 49.091 |
| Dec-24 | 46.739 |
Kenya Total Imports from USA
Key information about Kenya Total Imports from USAKenya Total Imports from USA recorded 75.816 USD mn in Dec 2024, compared with 76.618 USD mn in the previous monthKenya Total Imports from USA data is updated monthly, available from Jan 1998 to Dec 2024, with an averaged value of 40.975 USD mnThe data reached an all-time high of 484.668 USD mn in Nov 2015 and a record low of 3.947 USD mn in Jun 2000CEIC converts monthly Total Imports from USA into USD. The Central Bank of Kenya provides Total Imports from USA, CIF, in local currency. The Central Bank of Kenya average market exchange rate is used for currency conversions.
| Month | Total Imports from USA (USD mn) |
| Jan-24 | 104.827 |
| Feb-24 | 88.561 |
| Mar-24 | 79.537 |
| Apr-24 | 136.029 |
| May-24 | 86.59 |
| Jun-24 | 59.689 |
| Jul-24 | 78.789 |
| Aug-24 | 88.198 |
| Sep-24 | 90.427 |
| Oct-24 | 195.424 |
| Nov-24 | 76.618 |
| Dec-24 | 75.816 |
AmCham Trade Analytics
Top 5 Trade Partners (Import)
Trade Structure by Product (% of total, 2023)
| Rank | Exports | Imports |
| 1 | Black tea (fermented) and partly fermented tea | Petroleum oils, etc, (excl. crude); preparation |
| 2 | Fresh cut flowers and buds | Crude palm oil |
| 3 | Petroleum oils, etc, (excl. crude); preparation | Other medicaments of mixed or unmixed products |
| 4 | Coffee, not roasted or decaffeinated | Spelt, common wheat and meslin |
| 5 | Titanium ores and concentrates | Iron or non-alloy steel; in coils, flat-rolled, width 600mm or more, hot-rolled, less than 3mm thick, excluding minimum yield point of 275MPa |
High Level Indicators (2023)
| Income Group ****** | Lower middle income |
| Currency Unit | Currency Unit |
| Export | 6,023,441.81 in thousands of US$ |
| Imports | 19,594,117.73 in thousands of US$ |
| Trade balance | -9,381,928.76 in thousands of US$ |
| Exports of goods and services as percentage of GDP | 11.26% |
| Imports of goods and services as percentage of GDP | 20.16% |
Exports vs. Imports (Monthly)
Top 5 Trade Partners (Export)
U.S. TRADE IN GOODS WITH KENYA
| Exports | Imports | Balance | |
|---|---|---|---|
| January 2021 | 27.5 | 54.2 | -26.7 |
| February 2021 | 27.3 | 35.4 | -8.1 |
| March 2021 | 45.7 | 68.9 | -23.3 |
| April 2021 | 29.1 | 49.9 | -20.8 |
| May 2021 | 35.9 | 53.9 | -18.0 |
| June 2021 | 52.1 | 46.8 | 5.3 |
| July 2021 | 42.5 | 60.2 | -17.7 |
| TOTAL 2021 | 260.2 | 369.4 | -109.1 |


